


For detailed cases, please contact the consultant.
400-969-2866


2024-07-18 15:52:23 Source: Champ Consulting Visits:0
The Concept and Function of 1. Data Visualization
Through the "visualization" way, complex data through graphical means to effectively express, accurate and efficient, concise and comprehensive transmission of certain information, and even we help to discover certain laws and characteristics, mining the value behind the data.
The role of data visualization is mainly in the following areas:
Improve the comprehensibility of the data. Data visualization can transform abstract numbers and words into figurative graphics and colors, making data easier to be recognized and understood by the human visual system. Data visualization can also take advantage of different chart types and layouts to highlight the focus and relationships of the data, helping readers quickly capture the meaning and value of the data.
Enhance the memorability of data. Data visualization can use human visual memory and image association to combine data with visually impactful graphics and colors to improve data memorability. Data visualization can also use storytelling techniques to connect data with emotional and logical stories to enhance data memorability.
Increase the credibility of the data. Data visualization can improve the credibility of data by using objective data sources, clear data labeling, reasonable data processing, and transparent data display. Data visualization can also improve the credibility of the data by using appropriate chart types, avoiding misleading visuals, and providing context for the data.
Enhance the actability of data. Data visualization can enhance the actionability of data by using dynamic interactions that allow readers to filter, sort, compare, and aggregate data. Data visualization can also enhance the actability of data by using guiding visual cues that allow readers to analyze, interpret, evaluate, and reason about the data.
Application Scenarios and Value of 2. Data Visualization in Enterprise Research
Enterprise research refers to the collection, analysis and evaluation of relevant information of benchmarking enterprises to understand the strategies, strengths, weaknesses, opportunities and threats of benchmarking enterprises, so as to provide basis and reference for their own strategic decisions. The process and results of enterprise research often involve a large amount of data and information, such as the basic situation of the benchmark enterprise, market share, product characteristics, price strategy, marketing activities, customer satisfaction, financial situation, innovation ability, development trend, etc.
The application scenarios of data visualization in enterprise research are as follows:
Data collection. Data visualization can help enterprise researchers quickly obtain and organize data from a variety of data sources, such as networks, databases, reports, questionnaires, research, etc. Data visualization can also help enterprise researchers to clean, transform, merge and other pre-processing of data for subsequent analysis and presentation.
Data analysis. Data visualization can help enterprise researchers to analyze data in multi-dimensional, multi-level and multi-angle, such as descriptive analysis, correlation analysis, causal analysis, predictive analysis, etc. Data visualization can also help enterprise researchers discover patterns and characteristics in data, such as trends, patterns, anomalies, and differences.
Data presentation. Data visualization can help enterprise researchers present data to decision makers and stakeholders in an intuitive, vivid and persuasive way, such as charts, dashboards, data screens, storyboards, etc. Data visualization can also help enterprise researchers highlight the focus and relationship of data, convey the meaning and value of data, and make suggestions and action plans for data.
The value of data visualization in enterprise research is mainly in the following aspects:
Improve the efficiency of corporate research. Data visualization can reduce the time and cost of enterprise researchers in data collection, analysis and presentation, and improve the efficiency of enterprise research. Data visualization can also use automation and intelligent technology to realize real-time update and dynamic display of data, and improve the efficiency of enterprise research.
Improve the quality of corporate research. Data visualization can increase the understanding and memory of data for enterprise researchers and improve the quality of enterprise research. Data visualization can also increase the credibility of corporate research, increasing the persuasiveness and authority of data by using objective and transparent data presentations.
Enhancing the impact of corporate research. Data visualization can enhance the impact of corporate research, increasing the appeal and resonance of data through the use of vivid and attractive data presentations. Data visualization can also enhance the viability of enterprise research, increasing data engagement and feedback through the use of guided and interactive data presentations.
Design Principles and Steps for 3. Data Visualization
The design of data visualization is a complex and interesting process, which involves data selection, processing, analysis, presentation and other aspects, as well as visual, cognitive, aesthetic, communication and other fields. In order to ensure that the design of data visualization can achieve the desired purpose and effect, we need to follow some basic principles and steps.
The design principles of data visualization are as follows:
Goal-oriented. The design of data visualization should be goal-oriented, clarifying the purpose and audience of data visualization, as well as the information and value to be conveyed by data visualization. The design of data visualization should be based on the target and audience, select the appropriate data, charts, colors, layout and other elements, as well as the appropriate language, style, story and other techniques to achieve the goal of data visualization.
Concise and clear. The design of data visualization should be based on the principle of simplicity and clarity, avoiding the use of too many data, charts, colors, text and other elements, resulting in data visualization of congestion and confusion. The design of data visualization should remove irrelevant data and information, highlight the focus and relationship of the data, and make the meaning and value of data visualization clear at a glance.
True and accurate. The design of data visualization should be based on truthfulness and accuracy, ensure the objectivity and transparency of the source, labeling, processing, display and other aspects of the data, and avoid the use of erroneous, outdated, biased, and misleading data and information, resulting in distortion and misunderstanding of data visualization. The design of data visualization should use appropriate charts, proportions, scales, colors and other elements to ensure the integrity and correctness of the data, so that the credibility and authority of the data visualization is beyond doubt.
Interesting and useful. The design of data visualization should aim to be interesting and useful, increase the attractiveness and influence of the data, stimulate the emotion and resonance of the data, and promote the participation and feedback of the data. The design of data visualization should use vivid graphics, colors, animations, sound effects and other elements to increase the beauty and interest of the data, so that the appeal and resonance of data visualization is unparalleled. The design of data visualization should use interactive methods to increase the operability and customizability of data, and make the participation and feedback of data visualization impeccable.
The design steps for data visualization are as follows:
Data collection. Data collection is the first step in the design of data visualization, which involves obtaining and organizing data from a variety of data sources, such as networks, databases, reports, questionnaires, research, etc. The process of data collection should select the relevant data types, ranges, dimensions, metrics, etc., as well as the appropriate data format, quality, quantity, etc., based on the target and audience of the data visualization to ensure the validity and availability of the data.
Data processing. Data processing is the second step in the design of data visualization, which involves the pre-processing of data such as cleaning, transformation, and merging for subsequent analysis and presentation. The process of data processing should be based on the target and audience of data visualization, select the appropriate data tools, methods, techniques, etc., to ensure the accuracy and consistency of the data.
Data analysis. Data analysis is the third step in the design of data visualization, which involves multi-dimensional, multi-level and multi-angle analysis of data, such as descriptive analysis, correlation analysis, causal analysis, predictive analysis and so on. The process of data analysis should select appropriate data models, algorithms, metrics, etc. based on the target and audience of the data visualization to ensure that the data is meaningful and valuable.
Data presentation. Data presentation is the fourth step in the design of data visualization, which involves presenting data to decision makers and stakeholders in an intuitive, vivid and convincing way, such as charts, dashboards, data screens, storyboards, etc. The process of data presentation should be based on the target and audience of data visualization, select the appropriate chart type, color, layout, text and other elements, as well as the appropriate language, style, story and other techniques to ensure that the data is understandable, memorable, credible, and actionable.
Example of an enterprise research report 4. data visualization
To better illustrate the application and value of data visualization in enterprise research, we present an enterprise research report on data visualization, using the example of Champ Consulting, and evaluate it and make suggestions for improvement.
Champu Consulting is a company specializing in consulting services in the fields of strategy, management, innovation, and digitalization. Its customers include leading companies and public institutions in various industries. The main benchmarking companies of Shangpu Consulting are the following:
McKinsey & Company (McKinsey & Company): McKinsey & Company is the world's largest strategic consulting firm. It provides consulting services on strategy, organization, operations, digitalization, and innovation to 90% of the world's largest companies and government agencies.
Boston Consulting Group (Boston Consulting Group): Boston Consulting Group is one of the world's most well-known strategic consulting firms. It provides strategy, management, innovation, and digital consulting services to leading companies and public institutions in various industries around the world.
Bain & Company is one of the world's most popular strategy consulting firms, providing strategy, management, operations, digitalization, innovation and other consulting services to leading companies and public institutions in a wide range of industries around the world.
Consulting Services
economic database
See more>Brand Rankings
See more>
Shangpu Consulting Group: Market Survey of Top Ten Brands of imported Fruits in January 2023
Shangpu Consulting Group: Market Research on Top Ten New Products of Electrical Appliances in December 2022
Shangpu Consulting Group: Market Survey of Top Ten Popular Brands in January 2023
Shangpu Consulting Group: Market Research on Top Ten Brands of Home Administration Cleaning in January 2023
Shangpu Consulting-Market Research & Consulting China Pioneer
immediate consultationOn July 05, 2021, Shangpu Consulting received a satisfaction evaluation sheet from the customer for the "In-process Plastic Market Research Project in the Automotive Sector. The customer said: The project report completed by Shangpu Consulting in cooperation with our company is due to the wide range of projects and strong professional products. Thank you very much for the professional and detailed market research report of Shangpu Consulting. I look forward to cooperating again next time and wish Shangpu Consulting by going up one storey! Once again, I would like to thank the users for their support and wish them a prosperous career and an evergreen foundation!
On July 05, 2021, Shangpu Consulting received a satisfaction evaluation sheet from the customer for the "Research Project of the Network Designated City Transport Company. The customer said: The market research project provided by Shangpu Consulting for our company has provided us with a valuable reference basis for objectively evaluating the current market situation of the industry and achieved the expected goal. I also wish Champ Consulting the development of by going up one storey! Once again, I would like to thank the users for their support and wish them a prosperous career and an evergreen foundation!
July 07, 2020, Shangpu Consulting received a satisfaction evaluation sheet from the customer's "Lithium Battery Enterprise Sales Strategy and Production Cost Research Project. The customer said: The market research project provided by Shangpu Consulting for our company has provided us with a valuable reference basis for objectively evaluating the current market situation of the industry and achieved the expected goal. I also wish Champ Consulting the development of by going up one storey! Once again, I would like to thank the users for their support and wish them a prosperous career and an evergreen foundation!
On July 09, 2021, Shangpu Consulting received a satisfaction evaluation sheet from the customer for a hazardous waste treatment research project. The customer said: this is the organizational structure of the survey, the service process is very good, wish your company's consulting work is getting better and better, look forward to the next cooperation. I wish users a prosperous career, evergreen foundation!
On July 16, 2021, Shangpu Consulting received a satisfaction evaluation sheet from the customer for the Shared Beauty Research Project. The customer said: The content of Phase I and Phase II is satisfactory, and we look forward to signing a long-term agreement in the later period. The research part of the country will continue to cooperate with your company. I wish users a prosperous career, evergreen foundation!
On July 09, 2021, Shangpu Consulting received a satisfaction evaluation sheet from the customer for the "Research Project on the Organizational Structure of Two Liquor Production Enterprises. The customer said: This is an organizational structure survey, the service process is very good, looking forward to the next cooperation. I wish users a prosperous career, evergreen foundation!
On July 13, 2021, Shangpu Consulting received a satisfaction evaluation sheet from the customer for the "Research Project on the Operation of a Brand. The customer said: The content of Phase I and Phase II is satisfactory, and we look forward to signing a long-term agreement in the later period. The research part of the country will continue to cooperate with your company. I wish users a prosperous career, evergreen foundation!
On July 13, 2021, Shangpu Consulting received a satisfaction evaluation sheet from the customer for the "Zhoushan Sand and Stone Aggregate Market Research Project. The customer said: I am very satisfied with the consulting service provided by Shangpu Consulting. Shangpu Consulting can think of the customer, solve the problem for the customer in time, and do not hesitate to work overtime to meet the customer's needs. Our company is very grateful for this. I wish users a prosperous career, evergreen foundation!
On July 15, 2021, Shangpu Consulting received a satisfaction evaluation sheet from the customer for the "Brand Building and Protection Solutions Enterprise Research Project. The customer said: overall very satisfied, timely feedback, smooth communication, hope to cooperate more. I wish users a prosperous career, evergreen foundation!
On July 16, 2021, Shangpu Consulting received a satisfaction evaluation sheet from the customer for the "Research Project on the Rental Market of Mounter. The customer said: I am very satisfied with the consulting service provided by Shangpu Consulting. Shangpu Consulting can think of the customer, solve the problem for the customer in time, and do not hesitate to work overtime to meet the customer's needs. Our company is very grateful for this. I wish users a prosperous career, evergreen foundation!
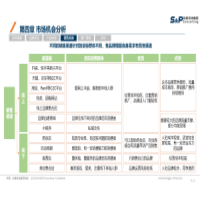
| Research Module | research content | ||||||
|---|---|---|---|---|---|---|---|
| Market research | Industry status | market capacity | Product Application | channel mode | Supply chain | market competition | Market Consulting |
| Enterprise Research | Enterprise background | Enterprise Finance | Sales Data | Market Strategy | Production Equipment | Supply Procurement | Technology R & D |
| warehousing logistics | channel construction | Human Resources | Enterprise Strategy | ||||
| User Research | Consumer Survey | consumption behavior attitude | Publicity/Promotion | Product Service | Brand Research | consumer characteristics | |
| satisfaction survey | Employee satisfaction | user satisfaction | |||||
| Market Entry Advisory | Macro Industry Research | competitive enterprise research | Downstream User Research | Channel Research | Due Diligence | Return on Investment | |
| Floor module | Landing implementation recommendations | Long-term cooperation | |||||
| Business investment due diligence | Target industry market investment value due diligence | Industry Benchmarking Enterprise Research | Target Enterprise Credit Assessment Report | Project investment due diligence | |||
| industry planning | Market research | market access | development strategy | investment location | Acquisition and integration | IPO Fundraising | |
| Credit Report | Basic information | Major Events | Production/Operation Network | enterprise scale | Operating strength | Financial strength | Legal risk |
| Future business prediction | Overall credit rating | cooperative risk warning | |||||
| Brand/Sales Proof | Market Share Proof | Market Share Proof | Proof of brand strength | Industry Proof | Specialized new proof | Proof of sales strength | Proof of technological leadership |
| National/Global Status Certificate | |||||||
15 Year
15 years of Shangpu consulting
48 Intellectual Property Rights
Independent methodology
80% of the information comes from first-hand research.
118 Billionth
Self-built database 11.8 billion
Covering 1978 industries in China
0.1 billion new data per year
Industry Big Data Platform
118 +
Have a 300 team of professional consultants
Practical operation and management experience of top enterprises
88% of members have international PMP certificates
48 Item
Independent methodology
48 independent intellectual property rights
high-tech enterprise
Industry Big Data Platform


400-969-2866
Scan to learn more information

Shangpu Consulting
Copyright Champu Consulting Group Co., Ltd. All Rights 京ICP备08011146号-6 Guo Tong Foreign-related Certificate No. 0709 Copyright @ 2008-2022 Shangpu-China.Com All Rights Reserved Map