


For detailed cases, please contact the consultant.
400-969-2866


2024-07-18 15:14:41 Source: Champ Consulting Visits:0
1. data sources
The first step of market research is to collect data. The sources of data can be divided into two categories: one is first-hand data, that is, data obtained directly from the target market or customers, such as questionnaires, research, observation, etc.; the other is Second-hand data, that is, data obtained from existing data sources, such as industry reports, statistical data, news media, etc. The choice of data source depends on the purpose, scope, budget and time of market research. Generally speaking, first-hand data can better reflect the actual situation of the market, but it is also more resource-consuming and energy-consuming, while second-hand data is easier to obtain, but there may also be problems such as deviation and obsolescence. Therefore, market research professionals need to make comprehensive use of first-hand data and second-hand data according to different situations to obtain more comprehensive and accurate data.
To facilitate data collection, market research professionals can use software and tools such:
Qualtrics: This is an online questionnaire survey platform that can help users design, publish and manage questionnaires, while providing data analysis and reporting functions. The advantage of the Qualtrics is that it supports multiple languages and devices, can customize the appearance and logic of the questionnaire, and can integrate social media and third-party data sources to expand the coverage of the questionnaire and improve the quality of the data. The disadvantage of Qualtrics is that the price is higher and you need to pay to use all the functions.
Zoom: This is a video conferencing software that can help users conduct online research, discussion and presentation, while providing recording, transcription and sharing functions. The advantages of Zoom are strong stability and compatibility, support up to 1000 people online at the same time, and can also be integrated with other software and tools, such as Slack, Dropbox, etc. The disadvantage of Zoom is that it sometimes has problems such as network delays and security risks.
Google Trends: This is a tool to show the search behavior of search engine users, which can help users understand the search trends and relevance of different regions, time and topics. The advantage of Google Trends is that the data sources are extensive and authoritative, which can reflect the needs and changes of the market, and can also be compared and analyzed with other data sources. The disadvantage of Google Trends is that the granularity and dimensions of the data are limited, and it cannot provide information such as specific search volume and user characteristics.
Case 1: Champu Consulting conducts market research for a car brand.
Commissioned by a car brand, Shangpu Consulting conducted a market research on the Chinese market to understand the needs, preferences and satisfaction of Chinese consumers for cars, as well as their awareness, attitude and loyalty to the brand. The following data sources were used by Champ Consulting:
First-hand data: Shangpu Consulting designed an online questionnaire using Qualtrics, conducted a sample survey of Chinese auto consumers, and collected 1000 valid questionnaires. The questionnaire contains basic information about consumers, the purchase and use of cars, the evaluation and suggestions of cars, and the cognition and attitude of the brand. The company also used Zoom to conduct some corporate research, and invited some automotive experts, industry professionals and consumer representatives to communicate and discuss with them about the current situation and trends of the automotive market, the competitiveness and differentiation of automotive brands, and consumers' psychology and behavior.
Second-hand data: Shangpu Consulting used Google Trends to analyze Chinese consumers' car-related search behavior in the past year, and found some interesting search trends and correlations, such as consumers' increasing interest in new energy vehicles. There are obvious seasonal changes in the search volume of certain car brands. Shangpu Consulting also collected some industry reports, statistics and news media information to understand the size, structure, growth and competition of China's auto market.
Through the comprehensive use of first-hand data and second-hand data, Shangpu Consulting Company provides a detailed market research report for the automobile brand, including the general situation of the market, the portrait of consumers, the positioning of the brand, the analysis of competition, the identification of opportunities and the proposal. The report has developed an effective strategy and action plan for the car brand to target the Chinese market, improving its competitiveness and visibility in the Chinese market.
2. data processing
The second step of market research is to process data, which includes data cleaning, sorting, conversion and statistics, in order to make the data more in line with the requirements of analysis, eliminate data errors and noise, and extract effective and useful information from the data. The process of data processing needs to be implemented with the help of some software and tools, such:
Excel: This is a spreadsheet software that can help users enter, edit, store and manage data, while providing data calculation, sorting, filtering, summarizing and charting functions. Excel is powerful and flexible, supports multiple data types and formats, and can be integrated with other software and tools, such as Power BI, Python, etc. The disadvantage of Excel is that the operation is complex and cumbersome, prone to errors and conflicts, and the processing capacity of large amounts of data is limited.
SPSS: This is a statistical analysis software that can help users perform descriptive analysis, inferential analysis, predictive analysis, and exploratory analysis of data, while providing data modeling, testing, validation, and reporting capabilities. SPSS has the advantages of professionalism and accuracy, support for a variety of statistical methods and techniques, and can also be integrated with other software and tools, such as R, Python, etc. The disadvantage of SPSS is that the interface and operation are not friendly enough, it requires a certain amount of learning and proficiency, and the price is high, and you need to pay to use all functions.
Tableau: This is a data visualization software that helps users transform data into various graphs and dashboards, while providing the ability to interact, explore, and share data. The advantage of the Tableau is that it is beautiful and easy to use, supports a variety of data sources and graphic types, and can be integrated with other software and tools, such as Excel, SPSS, etc. The disadvantage of Tableau is that it has limited data processing capacity, needs to use other software or tools for data cleaning and sorting, and the support for Chinese is not perfect.
Case 2: Shangpu Consulting conducted market research for a restaurant chain brand.
Commissioned by a restaurant chain brand, Shangpu Consulting conducted a market research on the Chinese market to understand the consumer behavior, preferences and satisfaction of Chinese consumers, as well as their awareness, attitude and loyalty to the brand. The following data processing methods are used by Champ Consulting:
Data cleaning: Shangpu Consulting Company used Excel to clean the collected questionnaire data, deleted some invalid and duplicate questionnaires, checked and corrected some wrong and abnormal data, and unified the format and unit of data for subsequent data analysis.
Data collation: Shangpu Consulting Company used Excel to collate the cleaned data, classifying and grouping the data according to different dimensions and indicators, such as age, gender, income, region, catering frequency, catering occasions, catering preference, catering evaluation, brand awareness, brand attitude, etc. of consumers, so as to facilitate subsequent data analysis.
Data conversion: Shangpu Consulting Company used Excel to convert the sorted data, converting some qualitative data into quantitative data, such as converting consumers' evaluation of catering into a score of 1-5 points, and converting consumers' attitude towards the brand into positive, neutral and negative labels to facilitate subsequent data analysis.
Statistics: Champ Consulting used SPSS to perform statistics on the converted data and calculated some basic statistics, such as mean, standard deviation, maximum, minimum, median, mode, etc., to understand the distribution and characteristics of the data. Shangpu Consulting also uses SPSS to perform some advanced statistical analysis, such as correlation analysis, regression analysis, factor analysis, cluster analysis, etc., to explore the relationship and structure of the data.
By using software and tools such as Excel and SPSS, Shangpu Consulting provided a comprehensive and in-depth data processing report for the restaurant chain brand, including the process and results of data cleaning, sorting, conversion and statistics, which laid a solid foundation for subsequent data analysis and presentation.
3. Data Visualization
The third step of market research is to visualize data. Data visualization is the process of converting data into graphs. The purpose is to make the data easier to understand and remember, highlight the focus and trend of the data, and stimulate the insight and creativity of the data. The process of data visualization requires the use of software and tools, such:
Power BI: This is a data analysis and visualization platform that helps users connect, transform, model, and visualize data, while providing the ability to interact, explore, and share data. Power BI has the advantage of being powerful and comprehensive, supporting multiple data sources and graph types, and integrating with other software and tools such as Excel, SPSS, Tableau, and more. The disadvantage of Power BI is that it is complicated and cumbersome to operate, requires certain learning and proficiency, and its support for Chinese is not perfect.
ECharts: This is a JavaScript-based data visualization library that helps users create a variety of dynamic and interactive graphics and dashboards on the web, while providing data updates, binding, and animation capabilities. The advantage of ECharts is that it is beautiful and easy to use, supports a variety of data types and graph types, and can be integrated with other libraries and frameworks, such as jQuery, React, etc. The disadvantage of ECharts is that it has limited data processing capacity, requires other software or tools to clean and organize the data, and requires a certain programming foundation and skills.
Infogram: This is an online data visualization platform that can help users convert data into various graphs, maps, icons and reports, while providing data import, editing and publishing functions. The advantage of Infogram is that it is simple and fast, supports a variety of data formats and graphic templates, and can also integrate with other platforms and tools, such as Excel, Google Drive, Dropbox, etc. The disadvantages of Infogram are limited functionality and customization, inability to support complex and advanced data analysis and visualization, and the need to pay to use all functions.
Case 3: Shangpu Consulting conducted market research for an e-commerce platform.
Commissioned by an e-commerce platform, Shangpu Consulting conducted a market research on the Chinese market to understand Chinese consumers' consumption behavior, preferences and satisfaction with e-commerce, as well as their awareness, attitude and loyalty to the platform. Champ Consulting used the following data visualization methods:
Data connection: Champ Consulting used Power BI to connect the collected questionnaire data with the transaction data provided by the platform, matching and merging the data from the two data sources for subsequent data analysis and visualization.
Data conversion: Shangpu Consulting Company used Power BI to convert the connected data, converting some qualitative data into quantitative data, such as converting consumers' evaluation of e-commerce into a score of 1-5 points, and converting consumers' attitude towards the platform into positive, neutral and negative labels, so as to facilitate subsequent data analysis and visualization.
Data modeling: Shangpu Consulting Company uses Power BI to model the converted data and creates some data metrics and dimensions, such as consumer consumption amount, consumption frequency, consumption category, consumption time, consumption area, consumption score, platform cognition, platform attitude, etc., to facilitate subsequent data analysis and visualization.
Data visualization: Shangpu Consulting Company used Power BI to visualize the modeled data and created some graphs and dashboards, such as consumer behavior analysis, consumer preference analysis, consumer satisfaction analysis, platform brand image analysis, platform brand loyalty analysis, etc. These graphs and dashboards help users visualize the distribution and characteristics of the data, discover patterns and trends in the data, compare differences and connections between the data, and derive dataConclusionand revelation.
By using software and tools such as Power BI, Shangpu Consulting provides a beautiful and vivid data visualization report for the e-commerce platform, including the process and results of data connection, transformation, modeling and visualization, which provides strong support for subsequent data presentation and application.
4. Data Report
The fourth step in market research is the presentation of data, which is the process of presenting the results of data analysis and visualization to the target audience in the form of text and graphics, with the aim of conveying the information and value of the data and influencing and persuading the decisions and actions of the target audience. The process of data presentation needs to be implemented with the help of some software and tools, such:
Word: This is a word processing software that helps users write, edit, and format documents, while providing the ability to insert, cite, and review documents. Word has the advantage of being powerful and flexible, supporting multiple document types and formats, and integrating with other software and tools such as Excel, PowerPoint, Power BI, and more. The disadvantage of Word is that the operation is complex and cumbersome, prone to errors and conflicts, and the support for graphics is not perfect.
PowerPoint: This is a presentation software that can help users create, edit and play slideshow, while providing slideshow design, animation and conversion functions. The advantages of the PowerPoint are strong aesthetics and ease of use, support for multiple slide types and templates, and can also be integrated with other software and tools, such as Excel, Word, Power BI, etc. The disadvantages of PowerPoint are limited functionality and customization, inability to support complex and advanced data analysis and visualization, and inadequate support for Chinese.
Canva: This is an online design platform that helps users create various graphics, posters, cards and reports, while providing the ability to select, edit and share graphics. Canva has the advantage of being simple and fast, supporting a variety of graphic templates and elements, and can also be integrated with other platforms and tools, such as Facebook, Instagram, Dropbox, etc. The disadvantages of Canva are limited functionality and customization, inability to support complex and advanced data analysis and visualization, and the need to pay to use all functions.
Case 4: Shangpu Consulting conducts market research for an educational institution.
Commissioned by an educational institution, Shangpu Consulting conducted a market research on the Chinese market to understand the needs, preferences and satisfaction of Chinese consumers for education, as well as their awareness, attitude and loyalty to the institution. The following data presentation methods were used by Champ Consulting:
Data reporting: Champ Consulting uses Word to compile a data report that presents the results of the analysis and visualization of the data in text and graphics to the management and decision makers of the educational institution. The data report includes the title of the report,AbstractCatalogue,Text、Conclusion, recommendations and references, and some appendices and annexes. Data reportingTextThe sections are organized and written according to the chapters of the market overview, the portrait of the consumer, the positioning of the institution, the analysis of competition, the identification of opportunities and the formulation of recommendations, each of which contains a description, analysis, visualization and interpretation of some data, as well as some key perspectives andConclusion. Data reportingConclusionSection summarizes the main findings and implications of the data, and puts forward some concrete and feasible suggestions and action plans for this educational institution. The references section of the data report lists the sources and citations of the data to ensure the credibility and validity of the data.
Data presentation: Champ Consulting created a data presentation using PowerPoint to present the results of data analysis and visualization in a slideshow to employees and partners of the educational institution. The data presentation includes the title, purpose, content,Conclusionand thank you and other parts, as well as some spare and supplementary slides. The content part of the data presentation is organized and written according to the topics of market overview, consumer portrait, organization positioning, competitive analysis, opportunity identification and proposal, each topic contains some data description, analysis, visualization and interpretation, as well as some key views and.Conclusion. Data PresentationConclusionSection summarizes the main findings and implications of the data, and puts forward some concrete and feasible suggestions and action plans for this educational institution. The thanks section of the data presentation expresses gratitude and expectation for the educational institution to enhance the partnership and trust with it.
Data Poster: Champ Consulting used Canva to create a data poster that graphically displays the results of data analysis and visualization to potential customers of the educational institution and the public. The data poster includes the title, slogan, graphics and contact information of the poster. The title section of the data poster uses the name and logo of the educational institution to increase its brand awareness and influence. The tagline section of the data poster uses a concise and powerful sentence to attract the attention and interest of the target audience. The graphics section of the data poster uses some visualizations and icons of the data to highlight the focus and trends of the data and stimulate insight and creativity in the target audience. The contact information section of the data poster provides information such as the educational institution's website, phone number and email address to facilitate consultation and communication with the target audience.
By using software and tools such as Word, PowerPoint and Canva, Champ Consulting provided the educational institution with a diverse and interesting data presentation report, including data reports, presentations and posters, which provided strong support and influence for the educational institution's strategy and decision-making.
Consulting Services
economic database
See more>Brand Rankings
See more>
Shangpu Consulting Group: Market Survey of Top Ten Brands of imported Fruits in January 2023
Shangpu Consulting Group: Market Research on Top Ten New Products of Electrical Appliances in December 2022
Shangpu Consulting Group: Market Survey of Top Ten Popular Brands in January 2023
Shangpu Consulting Group: Market Research on Top Ten Brands of Home Administration Cleaning in January 2023
Shangpu Consulting-Market Research & Consulting China Pioneer
immediate consultationOn July 05, 2021, Shangpu Consulting received a satisfaction evaluation sheet from the customer for the "In-process Plastic Market Research Project in the Automotive Sector. The customer said: The project report completed by Shangpu Consulting in cooperation with our company is due to the wide range of projects and strong professional products. Thank you very much for the professional and detailed market research report of Shangpu Consulting. I look forward to cooperating again next time and wish Shangpu Consulting by going up one storey! Once again, I would like to thank the users for their support and wish them a prosperous career and an evergreen foundation!
On July 05, 2021, Shangpu Consulting received a satisfaction evaluation sheet from the customer for the "Research Project of the Network Designated City Transport Company. The customer said: The market research project provided by Shangpu Consulting for our company has provided us with a valuable reference basis for objectively evaluating the current market situation of the industry and achieved the expected goal. I also wish Champ Consulting the development of by going up one storey! Once again, I would like to thank the users for their support and wish them a prosperous career and an evergreen foundation!
July 07, 2020, Shangpu Consulting received a satisfaction evaluation sheet from the customer's "Lithium Battery Enterprise Sales Strategy and Production Cost Research Project. The customer said: The market research project provided by Shangpu Consulting for our company has provided us with a valuable reference basis for objectively evaluating the current market situation of the industry and achieved the expected goal. I also wish Champ Consulting the development of by going up one storey! Once again, I would like to thank the users for their support and wish them a prosperous career and an evergreen foundation!
On July 09, 2021, Shangpu Consulting received a satisfaction evaluation sheet from the customer for a hazardous waste treatment research project. The customer said: this is the organizational structure of the survey, the service process is very good, wish your company's consulting work is getting better and better, look forward to the next cooperation. I wish users a prosperous career, evergreen foundation!
On July 16, 2021, Shangpu Consulting received a satisfaction evaluation sheet from the customer for the Shared Beauty Research Project. The customer said: The content of Phase I and Phase II is satisfactory, and we look forward to signing a long-term agreement in the later period. The research part of the country will continue to cooperate with your company. I wish users a prosperous career, evergreen foundation!
On July 09, 2021, Shangpu Consulting received a satisfaction evaluation sheet from the customer for the "Research Project on the Organizational Structure of Two Liquor Production Enterprises. The customer said: This is an organizational structure survey, the service process is very good, looking forward to the next cooperation. I wish users a prosperous career, evergreen foundation!
On July 13, 2021, Shangpu Consulting received a satisfaction evaluation sheet from the customer for the "Research Project on the Operation of a Brand. The customer said: The content of Phase I and Phase II is satisfactory, and we look forward to signing a long-term agreement in the later period. The research part of the country will continue to cooperate with your company. I wish users a prosperous career, evergreen foundation!
On July 13, 2021, Shangpu Consulting received a satisfaction evaluation sheet from the customer for the "Zhoushan Sand and Stone Aggregate Market Research Project. The customer said: I am very satisfied with the consulting service provided by Shangpu Consulting. Shangpu Consulting can think of the customer, solve the problem for the customer in time, and do not hesitate to work overtime to meet the customer's needs. Our company is very grateful for this. I wish users a prosperous career, evergreen foundation!
On July 15, 2021, Shangpu Consulting received a satisfaction evaluation sheet from the customer for the "Brand Building and Protection Solutions Enterprise Research Project. The customer said: overall very satisfied, timely feedback, smooth communication, hope to cooperate more. I wish users a prosperous career, evergreen foundation!
On July 16, 2021, Shangpu Consulting received a satisfaction evaluation sheet from the customer for the "Research Project on the Rental Market of Mounter. The customer said: I am very satisfied with the consulting service provided by Shangpu Consulting. Shangpu Consulting can think of the customer, solve the problem for the customer in time, and do not hesitate to work overtime to meet the customer's needs. Our company is very grateful for this. I wish users a prosperous career, evergreen foundation!
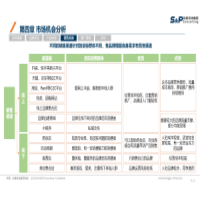
| Research Module | research content | ||||||
|---|---|---|---|---|---|---|---|
| Market research | Industry status | market capacity | Product Application | channel mode | Supply chain | market competition | Market Consulting |
| Enterprise Research | Enterprise background | Enterprise Finance | Sales Data | Market Strategy | Production Equipment | Supply Procurement | Technology R & D |
| warehousing logistics | channel construction | Human Resources | Enterprise Strategy | ||||
| User Research | Consumer Survey | consumption behavior attitude | Publicity/Promotion | Product Service | Brand Research | consumer characteristics | |
| satisfaction survey | Employee satisfaction | user satisfaction | |||||
| Market Entry Advisory | Macro Industry Research | competitive enterprise research | Downstream User Research | Channel Research | Due Diligence | Return on Investment | |
| Floor module | Landing implementation recommendations | Long-term cooperation | |||||
| Business investment due diligence | Target industry market investment value due diligence | Industry Benchmarking Enterprise Research | Target Enterprise Credit Assessment Report | Project investment due diligence | |||
| industry planning | Market research | market access | development strategy | investment location | Acquisition and integration | IPO Fundraising | |
| Credit Report | Basic information | Major Events | Production/Operation Network | enterprise scale | Operating strength | Financial strength | Legal risk |
| Future business prediction | Overall credit rating | cooperative risk warning | |||||
| Brand/Sales Proof | Market Share Proof | Market Share Proof | Proof of brand strength | Industry Proof | Specialized new proof | Proof of sales strength | Proof of technological leadership |
| National/Global Status Certificate | |||||||
15 Year
15 years of Shangpu consulting
48 Intellectual Property Rights
Independent methodology
80% of the information comes from first-hand research.
118 Billionth
Self-built database 11.8 billion
Covering 1978 industries in China
0.1 billion new data per year
Industry Big Data Platform
118 +
Have a 300 team of professional consultants
Practical operation and management experience of top enterprises
88% of members have international PMP certificates
48 Item
Independent methodology
48 independent intellectual property rights
high-tech enterprise
Industry Big Data Platform


400-969-2866
Scan to learn more information

Shangpu Consulting
Copyright Champu Consulting Group Co., Ltd. All Rights 京ICP备08011146号-6 Guo Tong Foreign-related Certificate No. 0709 Copyright @ 2008-2022 Shangpu-China.Com All Rights Reserved Map