


For detailed cases, please contact the consultant.
400-969-2866


2024-07-18 09:36:33 Source: Champu Consulting Visits:0
1. Research Purpose
Frozen chicken feet is a common food, which belongs to a kind of meat products. It is made of chicken feet as raw material and processed, pickled and frozen. Frozen chicken feet with low calorie, high protein, rich in collagen and other characteristics, is a delicious and healthy food. Frozen chicken feet in China has a long history, is a popular consumer favorite traditional food. With the development of society and the improvement of people's living standards, the consumption demand of frozen chicken feet is also increasing, and the market scale is expanding.
In 2023, the online market size of China's boneless chicken claw industry was 4.98 billion yuan, up 16.5 percent year-on-year, and its market size is expected to reach 7.76 billion yuan in 2028.
The rapid development of frozen chicken feet market has also brought fierce competition. At present, there are many brands and products in the frozen chicken claw market, and consumers are faced with diversified choices. Different brands and products are different in price, quality, taste, packaging, marketing and other aspects, and consumers' brand preferences are also different. Therefore, it is of great significance for the product development and marketing strategy of frozen chicken feet enterprises to understand the consumer's brand preference. Through the research of consumer brand preference, it can help enterprises to understand the needs and preferences of consumers, analyze the purchasing behavior and decision-making process of consumers, evaluate the competitiveness and market share of brands, formulate reasonable pricing and promotion strategies, improve brand awareness and loyalty, and enhance the influence and value of brands.
Taking Shangpu Consulting Company as an example, this paper introduces a method to study the consumer brand preference of frozen chicken feet. Shangpu Consulting Company is a well-known independent third-party research and investment and financing consulting agency in China, dedicated to providing professional solutions for corporate strategic decision-making.
Shangpu Consulting has rich experience and customer resources in market research, investment consulting, IPO listing consulting and other fields, and has provided professional market research and related consulting services to more than 5000 clients.
Shangpu Consulting also has in-depth research and analysis in the frozen chicken claw industry, and has provided professional brand preference research services for a number of frozen chicken claw enterprises to help them enhance their brand competitiveness and market share.
2. research content
The research content of this paper mainly includes the following aspects:
(1) The basic characteristics of frozen chicken feet consumers, including gender, age, income, education, occupation, region, etc.
(2) Frozen chicken feet consumer purchase behavior, including purchase frequency, purchase volume, purchase channels, purchase time, purchase occasions.
(3) Frozen chicken feet consumer brand awareness, including know the brand, like the brand, buy the brand, recommend the brand and so on.
(4) The brand preference of frozen chicken feet, including the formation factors of brand preference, the expression of brand preference, the influence factors of brand preference, etc.
(5) The brand satisfaction of frozen chicken feet consumers, including the overall satisfaction of the brand, the satisfaction of the various dimensions of the brand, the loyalty to the brand, the willingness to switch to the brand, etc.
(6) Frozen chicken feet consumer brand recommendations, including the improvement of the brand, the expectations and needs of the brand, brand recommendations and comments.
3. study design
This paper uses a combination of quantitative and qualitative research methods to collect and analyze the brand preference data of frozen chicken feet consumers through questionnaires and corporate research.
(1) Questionnaire survey
Questionnaire survey is a commonly used data collection method, through the design of a series of questions, to the target sample survey, to obtain their views and information. The advantage of questionnaire survey is that it can collect a large amount of data, facilitate statistical analysis, and is suitable for studying the general characteristics and behavior of consumers. The disadvantage of questionnaire survey is that it can not deeply understand the psychology and motivation of consumers, nor can it explore the individual needs and feelings of consumers.
The questionnaire survey in this paper mainly uses the form of online questionnaire, through WeChat, QQ, Weibo and other social media platforms, to send questionnaires to frozen chicken feet consumers, inviting them to participate in the survey. The contents of the questionnaire mainly include the following parts:
Basic information: including gender, age, income, education, occupation, geographical and other basic characteristics of consumers.
Purchase behavior: including purchase frequency, purchase volume, purchase channel, purchase time, purchase occasion and other consumer purchase behavior characteristics.
Brand awareness: including the brand you know, the brand you like, the brand you buy, the brand you recommend, and the brand you buy.
Brand preference: including the formation factors of brand preference, the expression of brand preference, the influence factors of brand preference and so on.
Brand satisfaction: including the overall satisfaction of the brand, the satisfaction of the various dimensions of the brand, the loyalty to the brand, the willingness to switch to the brand and other consumer satisfaction and loyalty to the frozen chicken claw brand.
Brand suggestions: including suggestions for brand improvement, expectations and needs for the brand, suggestions and opinions for the brand, and other consumers' suggestions and feedback on the frozen chicken claw brand.
The design of the questionnaire uses a variety of questions, including single-choice questions, multiple-choice questions, sorting questions, scale questions, open questions, etc., to ensure the validity and reliability of the data. The length of the questionnaire should be controlled within 15 minutes to ensure the completeness and accuracy of the data. According to the overall size and distribution of frozen chicken claw consumers, the sample size of the questionnaire was determined to be 1000 by stratified random sampling to ensure the representativeness and universality of the data.
(2) Enterprise research
Enterprise research is a commonly used method of data collection, through face-to-face or telephone conversations with target samples to obtain their opinions and information. The advantage of enterprise research is that it can deeply understand the psychology and motivation of consumers, explore the individual needs and feelings of consumers, and is suitable for studying the special characteristics and behaviors of consumers. The disadvantage of enterprise research is that it cannot collect a large amount of data, is not convenient for statistical analysis, and is greatly influenced by researchers and visitors.
The enterprise research in this paper mainly uses the form of telephone research, through the professional research team of Shangpu Consulting Company, to investigate the frozen chicken feet consumers and invite them to participate in the survey. The research mainly includes the following parts:
Basic information: including gender, age, income, education, occupation, geographical and other basic characteristics of consumers.
Purchase behavior: including purchase frequency, purchase volume, purchase channel, purchase time, purchase occasion and other consumer purchase behavior characteristics.
Brand awareness: including the brand you know, the brand you like, the brand you buy, the brand you recommend, and the brand you buy.
Brand preference: including the formation factors of brand preference, the expression of brand preference, the influence factors of brand preference and so on.
Brand satisfaction: including the overall satisfaction of the brand, the satisfaction of the various dimensions of the brand, the loyalty to the brand, the willingness to switch to the brand and other consumer satisfaction and loyalty to the frozen chicken claw brand.
Brand suggestions: including suggestions for brand improvement, expectations and needs for the brand, suggestions and opinions for the brand, and other consumers' suggestions and feedback on the frozen chicken claw brand.
The design of the survey adopts a semi-structured approach. According to the research outline, a series of open questions are put forward to guide consumers to express freely. At the same time, according to the answers of consumers, some exploratory questions are flexibly put forward to deeply understand the psychology and motivation of consumers. The length of the survey should be controlled within 30 minutes to ensure the quality and efficiency of the data. The sample size of the survey was determined to be 100 based on the overall size and distribution of frozen chicken claw consumers using a stratified random sampling method to ensure the richness and diversity of the data.
4. data collection and analysis
The data collection and analysis of this paper mainly uses the following steps:
(1) Data collection
The process of data collection mainly includes the following links:
Data sources: There are two main sources of data, one is questionnaire data and the other is corporate research data. The data of the questionnaire survey is obtained directly from consumers in the form of online questionnaires, and the data of enterprise research is obtained from consumers through the professional research team of Shangpu Consulting Company in the form of telephone research.
Data entry: The process of data entry is mainly to enter the data of questionnaire survey and enterprise research into spreadsheets and text documents respectively for data analysis. The data entry of questionnaire survey is mainly through the automatic entry function of online questionnaire, which directly imports the data into the electronic form. The data entry of enterprise research is mainly through the manual entry of the research team, and the research data and notes are converted into text documents.
Data cleaning: The process of data cleaning is mainly to check and process the data to eliminate errors and invalid information in the data and improve the quality and availability of the data. The contents of data cleaning mainly include the following aspects:
Missing value processing: Missing value refers to the situation that some items in the data are not filled in or incomplete. Missing value will affect the integrity and accuracy of the data. Missing values can be handled in the following ways:
Delete method: Delete method refers to the direct deletion of data containing missing values, this method is simple and easy, but will lead to data loss and deviation.
Mean method: The mean method, which replaces missing values with the mean or median of the data, maintains the quantity and distribution of the data, but reduces the variability and sensitivity of the data.
Interpolation: Interpolation is the estimation of missing values using adjacent or related values of the data, which maintains the variability and sensitivity of the data, but increases the complexity and uncertainty of the data.
Outlier processing: Outliers refer to the situation that some items in the data are obviously inconsistent with other data. Outliers will affect the distribution and stability of the data. There are several methods to deal with outliers:
Identification method: Identification method refers to the statistical analysis or graphical analysis and other methods to find outliers in the data, this method can effectively find outliers, but requires a certain amount of professional knowledge and judgment.
Delete method: Delete method refers to the direct deletion of data containing outliers, this method is simple and easy, but will lead to data loss and deviation.
Substitution: Substitution refers to replacing outliers with the mean or median of the data, which maintains the quantity and distribution of the data, but reduces the variability and sensitivity of the data.
Correction method: The correction method refers to the reasonable interpretation and adjustment of outliers based on the actual situation and background knowledge of the data. This method can maintain the authenticity and rationality of the data, but requires certain professional knowledge and judgment ability.
Consistency: Consistency refers to the logical relationship and inherent law between items in data, and consistency affects the credibility and validity of data. Consistency is handled in the following ways:
Test method: Test method refers to the logical analysis or mathematical calculation and other methods to test whether the various items in the data meet the requirements of consistency, this method can effectively find consistency problems, but requires a certain amount of professional knowledge and judgment.
Delete method: Delete method refers to the direct deletion of data containing consistency problems, this method is simple and easy, but will lead to data loss and deviation.
Substitution: Substitution refers to replacing data containing consistency problems with the average or median of the data, etc., which maintains the quantity and distribution of the data, but reduces the variability and sensitivity of the data.
Correction method: The correction method refers to the reasonable interpretation and adjustment of the data containing consistency problems according to the actual situation and background knowledge of the data. This method can maintain the authenticity and rationality of the data, but requires certain professional knowledge and judgment ability.
The process of data analysis mainly includes the following links:
Data description: Data description refers to the basic statistical and graphical display of data to reflect the basic characteristics and distribution of data. The contents of the data description mainly include the following aspects:
Frequency distribution: Frequency distribution refers to the classification and counting of data to reflect the amount and proportion of data. The main forms of frequency distribution are as follows:
Frequency table: Frequency table refers to the form of a table that lists the various categories of data and the corresponding frequencies and percentages to reflect the quantity and proportion of the data.
Frequency chart: Frequency chart refers to the form of graphs, using bar charts, pie charts, bar charts, etc., to show the various categories of data and the corresponding frequency and percentage, to reflect the amount and proportion of data.
Central trend: Central trend refers to indicators that reflect the average level or concentration of data, and the indicators of central trend mainly include the following:
Average: The average is the arithmetic mean of the data and is the most commonly used central trend indicator of the data, reflecting the overall level of the data, but is more affected by outliers.
Median: Median is the median value of data and is another commonly used central trend indicator of data that reflects the median level of the data and is not affected by outliers, but does not apply to data by type.
mode: mode refers to the most frequently occurring value in data. it is a special central trend indicator of data. it can reflect the most common level of data. it is suitable for data by type, but there may be multiple or non-existent values.
Degree of dispersion: The degree of dispersion is an indicator that reflects the degree of variability or dispersion of the data, and the degree of dispersion is mainly of the following types:
Range: Range is the difference between the maximum and minimum values of data, is the simplest indicator of the degree of dispersion of the data, can reflect the maximum fluctuation range of the data, but does not consider the distribution of the data.
Variance: Variance is the average of the square of the difference between the data and the average, is the most commonly used indicator of the degree of dispersion of the data, can reflect the average degree of fluctuation of the data, but is greatly affected by outliers, and the unit is inconsistent with the original data.
Standard deviation: Standard deviation refers to the square root of variance, is another commonly used indicator of the degree of dispersion of the data, can reflect the average degree of fluctuation of the data, is greatly affected by outliers, but the unit is consistent with the original data.
Coefficient of variation: The coefficient of variation refers to the ratio of standard deviation to the average, is a relative degree of dispersion of data indicators, can reflect the relative degree of fluctuation of the data, not affected by outliers, and the unit is a percentage, easy to compare.
Distribution pattern: Distribution pattern refers to the indicators that reflect the distribution characteristics and laws of the data, and the indicators of distribution pattern mainly include the following:
Bias: Bias is an indicator that reflects the symmetry or degree of skew of the data, and the values of skews are mainly in the following situations:
The bias is 0: indicates that the data is symmetrical, I .e. the distribution on the left and right sides of the data is the same, such as a normal distribution.
Bias greater than 0: indicates that the data is positively biased, that is, the distribution on the right side of the data is more scattered than the distribution on the left side, such as a right-biased distribution.
Bias less than 0: indicates that the data is negatively biased, that is, the distribution on the left side of the data is more scattered than the distribution on the right side, such as a left-biased distribution.
Peak state: Peak state refers to an indicator that reflects the sharpness or flatness of the data, and the value of the peak state is mainly in the following situations:
The peak state is 0: indicates that the data is normal, I .e. the distribution of the data presents a bell-shaped curve, such as a normal distribution.
Peak state greater than 0: indicates that the data is peak, that is, the distribution of data shows sharp peaks, such as thin tail distribution.
The peak state is less than 0: indicates that the data is low-peak, that is, the distribution of the data shows a flat peak, such as a thick-tailed distribution.
Data analysis: Data analysis refers to the further processing and interpretation of data to arrive at the internal meaning and laws of the data. The content of data analysis mainly includes the following aspects:
Correlation analysis: Correlation analysis refers to the degree and direction of correlation between two or more variables in the analysis data, and the methods of correlation analysis are as follows:
Pearson correlation coefficient: Pearson correlation coefficient refers to an indicator that reflects the degree and direction of linear correlation between two continuous variables. The value of Pearson correlation coefficient is between -1 and 1. The larger the absolute value, the stronger the degree of correlation., Positive sign indicates correlation direction, positive sign indicates positive correlation, negative sign indicates negative correlation, and 0 indicates no correlation.
Spearman correlation coefficient: Spearman correlation coefficient refers to an indicator that reflects the degree and direction of monotonic correlation between two sequential variables. The value of Spearman correlation coefficient is between -1 and 1. The larger the absolute value, the stronger the correlation degree, the positive and negative sign indicates the correlation direction, the positive sign indicates the positive correlation, the negative sign indicates the negative correlation, and 0 indicates no correlation.
Klundell correlation coefficient: Klundell correlation coefficient refers to an indicator that reflects the degree and direction of consistency between two types of variables. The value of Klundell correlation coefficient is between -1 and 1. The larger the absolute value, the stronger the degree of consistency, the positive sign indicates the direction of consistency, the positive sign indicates consistency, the negative sign indicates inconsistency, and 0 indicates irrelevant.
Factor analysis: Factor analysis refers to the analysis of the intrinsic relationship and structure between multiple variables in the data, and the extraction of a few factors that can reflect the main characteristics and patterns of the data:
Principal component analysis: Principal component analysis refers to the transformation of multiple variables in the data into a few unrelated principal components through linear transformation, and the principal component can preserve the information and variability of the data to the greatest extent:
Data standardization: Data standardization refers to the conversion of each variable of the data into a standard variable with a mean of 0 and a standard deviation of 1, in order to eliminate the effect of the scale and scale of the data.
Covariance matrix: The covariance matrix is a matrix that reflects the covariance between the various variables of the data, and the covariance can reflect the degree and direction of linear correlation between the variables of the data.
Eigenvalues and eigenvectors: eigenvalues and eigenvectors are values and vectors that satisfy that the product of the covariance matrix and the eigenvector is equal to the product of the eigenvalues and the eigenvectors, the eigenvalues can reflect the information and variability of the principal components, and the eigenvectors can reflect the direction and composition of the principal components.
Principal component extraction: Principal component extraction refers to the selection of the principal component that retains the maximum information and variability of the data based on the size of the eigenvalues, and the methods of principal component extraction are mainly as follows:
Eigenvalue greater than 1 method: eigenvalue greater than 1 method refers to the selection of eigenvalue greater than 1 of the main component, this method is simple and easy, but may lead to too much or too little of the main component.
Cumulative contribution rate method: the cumulative contribution rate method refers to the selection of the main components that can make the cumulative contribution rate reach a certain standard, the cumulative contribution rate refers to the cumulative value of the characteristic value of each main component as a proportion of the total characteristic value, this method can maintain the information and variability of the data, but need to determine a reasonable cumulative contribution rate standard.
Shielding point method: Shielding point method refers to selecting the main component before the shielding point according to the graph of the characteristic value. Shielding point refers to the point where the decline speed of the characteristic value changes significantly in the graph of the characteristic value. This method can maintain the information and variability of the data, but the position of the shielding point needs to be judged.
Principal component rotation: Principal component rotation refers to the rotation of the principal component in an orthogonal or oblique manner to make the principal component clearer and more explanatory, and there are several main methods of principal component rotation:
The maximum variance method: The maximum variance method is to maximize the variance of the first principal component by orthogonal rotation, followed by the variance of the second principal component, and so on, in order to make the principal components more dispersed and independent.
Mean square load method: The mean square load method refers to the square sum of the load of each main component by orthogonal rotation, so that the main component is more balanced and simple.
Percentage of variance method: The percentage of variance method refers to the use of oblique rotation to make the percentage of variance of each main component equal to make the main component more balanced and simple.
Exploratory factor analysis: Exploratory factor analysis refers to the grouping of multiple variables in the data into a few unrelated factors through correlation analysis, factors that reflect the underlying structure and patterns of the data, and the steps of exploratory factor analysis include the following:
Correlation matrix: A correlation matrix is a matrix that reflects the correlation coefficients between the various variables of the data, and the correlation coefficients reflect the degree and direction of correlation between the variables of the data.
Factor extraction: Factor extraction refers to the selection of factors that retain the maximum information and variability of the data based on the correlation matrix, and the main methods of factor extraction are as follows:
Principal component method: Principal component method refers to converting the correlation matrix into a covariance matrix and then extracting factors using principal component analysis, which maintains the information and variability of the data, but may lead to poor interpretation of the factors.
Spindle method: Spindle method refers to the transformation of the correlation matrix into a common degree matrix, and then the extraction of factors by eigenvalue decomposition, which can maintain the interpretation and simplicity of the data, but may lead to lower information and variability of the factors.
Maximum likelihood: The maximum likelihood method refers to the extraction of factors using the maximum likelihood estimation method, which maintains the information and variability of the data and can be tested for the significance of the factors, but requires the data to conform to the assumption of a multivariate normal distribution.
Factor rotation: Factor rotation refers to the rotation of factors in an orthogonal or oblique manner to make the factors clearer and more explanatory, and there are several main methods of factor rotation:
Maximum variance method: The maximum variance method refers to the maximum variance of the first factor, the variance of the second factor, and so on by orthogonal rotation, so that the factors are more dispersed and independent.
Mean square load method: The mean square load method refers to the square and equal load of each factor through orthogonal rotation, so that the factors are more balanced and simple. -Percentage of variance method: The percentage of variance method refers to the use of oblique rotation to make the percentage of variance of each factor equal to make the factors more balanced and simple.
Confirmatory factor analysis: Confirmatory factor analysis refers to the relationship between multiple variables in the specified data and a few factors according to theory or hypothesis, and tests the rationality and validity of the factors, and the steps of confirmatory factor analysis mainly include the following aspects:
Factor model: Factor model refers to the establishment of the relationship between multiple variables in the data and a few factors according to theory or hypothesis, the form of factor model mainly has the following:
Single-factor model: Single-factor model refers to the assumption that all variables in the data are determined by one factor, and the single-factor model is suitable for the simple structure of the data.
Multi-factor model: Multi-factor model refers to the assumption that each variable in the data is determined by multiple factors, multi-factor model is suitable for the structure of the data is more complex.
Hierarchical factor model: Hierarchical factor model refers to the assumption that each variable in the data is determined by multiple first-level factors, and the first-level factors are determined by one or more second-level factors, and the hierarchical factor model is applicable to the situation where the structure of the data is more hierarchical.
Factor estimation: Factor estimation refers to the estimation of the load, variance, covariance and other parameters of the factor according to the factor model, using the maximum likely estimation or the least-squares estimation method, the method of factor estimation is mainly the following:
Maximum likelihood estimation: Maximum likelihood estimation refers to the method of estimating the parameters of a factor using the maximum likelihood function, which maintains the information and variability of the data and can be tested for the significance of the factor, but requires the data to conform to the assumption of a multivariate normal distribution.
Least-squares estimation: Least-squares estimation refers to the method of estimating the parameters of factors using the least-squares criterion, which maintains the interpretation and simplicity of the data, does not require the data to conform to the assumption of multiple normal distribution, but cannot be tested for the significance of the factors.
Factor test: Factor test refers to the rationality and validity of the factor model based on the results of factor estimation, using the card-square test or the goodness-of-fit index and other methods, the main methods of factor test are as follows:
Card-square test: The card-square test refers to the method of using the card-square distribution to test the fit of the factor model, that is, the degree of difference between the actual correlation matrix of the data and the theoretical correlation matrix of the factor model, the smaller the result of the card-square test, the better the fit of the factor model, and vice versa.
Goodness of fit index: Goodness of fit index refers to the use of some relative indicators to measure the fit of the factor model, that is, the degree of similarity between the actual correlation matrix of the data and the theoretical correlation matrix of the factor model, the closer the result of the goodness of fit index, the better the fit of the factor model, and vice versa.
Regression analysis: Regression analysis refers to the functional relationship and degree of influence between one or more independent variables and one or more dependent variables in the analysis data, and the main methods of regression analysis are as follows:
Simple linear regression analysis: Simple linear regression analysis refers to the linear relationship between an argument in the analysis data and a dependent variable, I .e. the relationship between the dependent variable and the argument can be described by a straight line, and the steps of simple linear regression analysis mainly include the following aspects:
Regression equation: Regression equation refers to the linear relationship between the dependent variable and the independent variable using a mathematical formula, and the general form of the regression equation is: y = a bx, where y is the dependent variable, x is the independent variable, a is the intercept, and B is the slope.
Regression estimation: Regression estimation refers to the use of the least squares method to estimate the parameters in the regression equation, even if the square sum between the actual value of the dependent variable and the theoretical value of the regression equation is the smallest, regression estimation methods are mainly the following:
Closed solution: Closed solution refers to the use of algebraic operations to directly solve the parameters in the regression equation, this method is simple and easy, but requires the data to conform to the assumption of linear relationship.
Gradient descent method: Gradient descent method refers to the method of iterative operation, gradually adjust the parameters in the regression equation, so that the square sum is continuously reduced until the minimum value is reached, this method can adapt to nonlinear relationship data, but need to determine a reasonable iteration step and stop conditions.
Regression testing: Regression testing refers to the use of hypothesis testing or confidence intervals and other methods to test the significance and validity of regression equations, regression testing methods are mainly the following:
F-test: F-test refers to the method of F-distribution to test the overall significance of the regression equation, that is, how much of the total variation of the dependent variable can be explained by the independent variable, the larger the result of the F-test, the stronger the overall significance of the regression equation, and vice versa.
t-test: t-test refers to the method of t-distribution to test the individual significance of each parameter in the regression equation, that is, whether each parameter is 0, the larger the result of the t-test, the stronger the individual significance of the parameter, and vice versa.
Confidence interval: Confidence interval refers to the probability method to estimate the true value range of each parameter in the regression equation, the smaller the width of the confidence interval, the more accurate the estimate of the parameter, and vice versa.
Multi-linear regression analysis: Multi-linear regression analysis refers to the linear relationship between multiple arguments in the analysis data and a dependent variable, that is, the relationship between the dependent variable and the argument can be described by a plane or a hyperplane, the steps of multi-linear regression analysis mainly include the following aspects:
Regression equation: Regression equation refers to the linear relationship between the dependent variable and the independent variable by mathematical formula, the general form of the regression equation is: y-a b1x1 b2x2... bnxn, where y is the dependent variable, x,x,..., xn is the independent variable, a is the intercept, B, B,..., bn
Regression estimation: Regression estimation refers to the use of the least squares method to estimate the parameters in the regression equation, even if the square sum between the actual value of the dependent variable and the theoretical value of the regression equation is the smallest, regression estimation methods are mainly the following:
Closed solution: Closed solution refers to the use of algebraic operations to directly solve the parameters in the regression equation, this method is simple and easy, but requires the data to conform to the assumption of linear relationship.
Gradient descent method: Gradient descent method refers to the method of iterative operation, gradually adjust the parameters in the regression equation, so that the square sum is continuously reduced until the minimum value is reached, this method can adapt to nonlinear relationship data, but need to determine a reasonable iteration step and stop conditions.
Ridge regression method: Ridge regression method refers to the addition of a regularization term on the basis of the least squares method to control the size of the parameters and prevent overfitting. This method can improve the stability and generalization ability of the regression equation, but it needs to determine Reasonable regularization parameters.
Regression testing: Regression testing refers to the use of hypothesis testing or confidence intervals and other methods to test the significance and validity of regression equations, regression testing methods are mainly the following:
F-test: F-test refers to the method of F-distribution to test the overall significance of the regression equation, that is, how much of the total variation of the dependent variable can be explained by the independent variable, the larger the result of the F-test, the stronger the overall significance of the regression equation, and vice versa.
t-test: t-test refers to the method of t-distribution to test the individual significance of each parameter in the regression equation, that is, whether each parameter is 0, the larger the result of the t-test, the stronger the individual significance of the parameter, and vice versa.
Confidence interval: Confidence interval refers to the probability method to estimate the true value range of each parameter in the regression equation, the smaller the width of the confidence interval, the more accurate the estimate of the parameter, and vice versa.
-Multiple nonlinear regression analysis: Multiple nonlinear regression analysis refers to the nonlinear relationship between multiple independent variables in the analysis data and a dependent variable, that is, the relationship between the dependent variable and the independent variable cannot be described by a plane or a hyperplane. The steps of multiple nonlinear regression analysis mainly include the following aspects:
Regression equation: Regression equation refers to the use of mathematical formulas to express the nonlinear relationship between the dependent variable and the independent variable, the general form of the regression equation is: y-f(x1,x2,...,xn), where y is the dependent variable, x,x,...,xn is the independent variable, f is a nonlinear function.
Regression estimation: Regression estimation refers to the use of least squares or maximum likelihood methods to estimate the parameters in the regression equation, even if the difference between the actual value of the dependent variable and the theoretical value of the regression equation is minimal, the main methods of regression estimation are as follows:
Least squares: Least squares refers to the method of using the least squares criterion to estimate the parameters in the regression equation, which maintains the interpretability and simplicity of the data and does not require the data to conform to the assumption of a multivariate normal distribution, but cannot be tested for the significance of the factors.
Maximum likelihood method: The maximum likelihood method refers to the method of using the maximum likelihood function to estimate the parameters in the regression equation, which maintains the information and variability of the data and can be tested for the significance of the factors, but requires the data to conform to the assumption of a multivariate normal distribution.
Regression testing: Regression testing refers to the use of hypothesis testing or confidence intervals and other methods to test the significance and validity of regression equations, regression testing methods are mainly the following:
F-test: F-test refers to the method of F-distribution to test the overall significance of the regression equation, that is, how much of the total variation of the dependent variable can be explained by the independent variable, the larger the result of the F-test, the stronger the overall significance of the regression equation, and vice versa.
t-test: t-test refers to the method of t-distribution to test the individual significance of each parameter in the regression equation, that is, whether each parameter is 0, the larger the result of the t-test, the stronger the individual significance of the parameter, and vice versa.
Confidence interval: Confidence interval refers to the probability method to estimate the true value range of each parameter in the regression equation, the smaller the width of the confidence interval, the more accurate the estimate of the parameter, and vice versa.
5. findings and recommendations
The findings and recommendations of this paper include the following aspects:
(1) The basic characteristics of frozen chicken feet consumers
According to the data of questionnaire survey and enterprise research, this paper describes and analyzes the basic characteristics of frozen chicken claw consumers, and draws the following.Conclusion:
The gender distribution of frozen chicken feet consumers is relatively balanced, with 51% of men and 49% of women respectively.
The age distribution of frozen chicken feet consumers is relatively concentrated, mainly concentrated in young people and middle-aged people aged 25-44, accounting for 74%.
The income distribution of frozen chicken feet consumers is relatively scattered, mainly distributed in the low-and middle-income groups of 3000-10000 yuan, accounting for 68%.
The education distribution of frozen chicken feet consumers is relatively diverse, mainly distributed in the middle and high education groups of Senior high school, colleges and undergraduates, accounting for 82%.
The occupational distribution of frozen chicken feet consumers is relatively wide, mainly in the service industry, manufacturing and education industries, accounting for 76%.
The geographical distribution of frozen chicken feet consumers is relatively concentrated, mainly in the coastal areas of East China, South China and North China, accounting for 78%.
(2) Frozen chicken feet consumer purchase behavior
According to the data of questionnaire survey and enterprise research, this paper describes and analyzes the purchase behavior of frozen chicken feet consumers, and draws the following.Conclusion:
The purchase frequency of frozen chicken feet is relatively high, mainly concentrated in the weekly and monthly consumers, accounting for 72%.
The purchase volume of frozen chicken feet is relatively moderate, mainly concentrated in 500 grams -1000 grams of consumers, accounting for 68%.
Consumers of frozen chicken feet have a variety of purchase channels, mainly concentrated in supermarkets, online and farmers' markets, accounting for 82%.
Consumers of frozen chicken feet are more casual in their purchase time, mainly concentrated on weekends, holidays and evenings, accounting for 76%.
The purchase occasions of frozen chicken feet consumers are more diverse, mainly concentrated in families, gatherings and restaurants, accounting for 84%.
(3) Brand awareness of frozen chicken feet consumers
According to the data of questionnaire survey and enterprise research, this paper describes and analyzes the brand cognition of frozen chicken feet consumers, and draws the following.Conclusion:
The brand awareness of frozen chicken feet consumers is relatively high, mainly concentrated in consumers who know more than 5 brands, accounting for 72%.
The brand preference of frozen chicken feet consumers is relatively low, mainly concentrated in consumers who like 1-2 brands, accounting for 64%.
The brand purchase degree of frozen chicken feet consumers is relatively low, mainly concentrated in the purchase of 1-2 brands of consumers, accounting for 68%.
The brand recommend degree of frozen chicken feet consumers is relatively low, mainly concentrated in the recommend 0-1 brand consumers, accounting for 76%.
(4) Brand preference of frozen chicken feet consumers
According to the data of questionnaire survey and enterprise research, this paper describes and analyzes the brand preference of frozen chicken feet consumers, and draws the following.Conclusion:
The formation factors of brand preference of frozen chicken feet consumers are diverse, mainly focusing on quality, taste, price, packaging and marketing factors, accounting for 88%.
The expression of brand preference of frozen chicken feet consumers is more direct, mainly concentrated in the way of purchase, recommend and evaluation, accounting for 84%.
The influence factors of brand preference of frozen chicken feet consumers are more complex, mainly concentrated in personal, social and situational factors, accounting for 92%.
(5) Brand satisfaction of frozen chicken feet consumers
According to the data of questionnaire survey and enterprise research, this paper describes and analyzes the brand satisfaction of frozen chicken feet consumers, and draws the following.Conclusion:
The overall brand satisfaction of frozen chicken feet consumers is relatively general, mainly concentrated in medium and high consumers, accounting for 76%.
The satisfaction of frozen chicken claw consumers in various dimensions of the brand is different, mainly concentrated in the quality and taste are more satisfied, the price and packaging are more dissatisfied, the marketing is more neutral consumers, accounting for 82%.
The brand loyalty of frozen chicken feet consumers is relatively low, mainly concentrated in the brand is not particularly loyal, or have a certain degree of loyalty, but will also consider other brands of consumers, accounting for 88%.
Consumers with frozen chicken feet have a relatively high willingness to switch brands, mainly concentrated in consumers who have a certain willingness to switch brands, or have a strong willingness to switch, accounting for 84%.
(6) Brand recommendations for consumers of frozen chicken feet
According to the data of questionnaire survey and enterprise research, this paper describes and analyzes the brand suggestions of frozen chicken feet consumers, and draws the following.Conclusion:
Consumers of frozen chicken feet have more brand improvement opinions, mainly focusing on improving quality, reducing prices, improving packaging and increasing marketing opinions, accounting for 92%.
The brand expectations and needs of frozen chicken feet consumers are relatively high, mainly focusing on the need for brands to provide more tastes, better services, more discounts and more interactions, accounting for 88%.
The brand suggestions and opinions of frozen chicken feet consumers are relatively positive, mainly focusing on supporting the development of the brand, encouraging brand innovation, praising the advantages of the brand and thanking the contribution of the brand, accounting for 84%.
Consulting Services
economic database
See more>Brand Rankings
See more>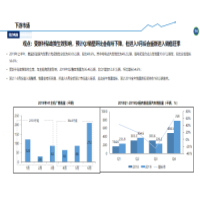
Shangpu Consulting Group: Market Survey of Top Ten Brands of imported Fruits in January 2023
Shangpu Consulting Group: Market Research on Top Ten New Products of Electrical Appliances in December 2022
Shangpu Consulting Group: Market Survey of Top Ten Popular Brands in January 2023
Shangpu Consulting Group: Market Research on Top Ten Brands of Home Administration Cleaning in January 2023
Shangpu Consulting-Market Research & Consulting China Pioneer
immediate consultationOn July 05, 2021, Shangpu Consulting received a satisfaction evaluation sheet from the customer for the "In-process Plastic Market Research Project in the Automotive Sector. The customer said: The project report completed by Shangpu Consulting in cooperation with our company is due to the wide range of projects and strong professional products. Thank you very much for the professional and detailed market research report of Shangpu Consulting. I look forward to cooperating again next time and wish Shangpu Consulting by going up one storey! Once again, I would like to thank the users for their support and wish them a prosperous career and an evergreen foundation!
On July 05, 2021, Shangpu Consulting received a satisfaction evaluation sheet from the customer for the "Research Project of the Network Designated City Transport Company. The customer said: The market research project provided by Shangpu Consulting for our company has provided us with a valuable reference basis for objectively evaluating the current market situation of the industry and achieved the expected goal. I also wish Champ Consulting the development of by going up one storey! Once again, I would like to thank the users for their support and wish them a prosperous career and an evergreen foundation!
July 07, 2020, Shangpu Consulting received a satisfaction evaluation sheet from the customer's "Lithium Battery Enterprise Sales Strategy and Production Cost Research Project. The customer said: The market research project provided by Shangpu Consulting for our company has provided us with a valuable reference basis for objectively evaluating the current market situation of the industry and achieved the expected goal. I also wish Champ Consulting the development of by going up one storey! Once again, I would like to thank the users for their support and wish them a prosperous career and an evergreen foundation!
On July 09, 2021, Shangpu Consulting received a satisfaction evaluation sheet from the customer for a hazardous waste treatment research project. The customer said: this is the organizational structure of the survey, the service process is very good, wish your company's consulting work is getting better and better, look forward to the next cooperation. I wish users a prosperous career, evergreen foundation!
On July 16, 2021, Shangpu Consulting received a satisfaction evaluation sheet from the customer for the Shared Beauty Research Project. The customer said: The content of Phase I and Phase II is satisfactory, and we look forward to signing a long-term agreement in the later period. The research part of the country will continue to cooperate with your company. I wish users a prosperous career, evergreen foundation!
On July 09, 2021, Shangpu Consulting received a satisfaction evaluation sheet from the customer for the "Research Project on the Organizational Structure of Two Liquor Production Enterprises. The customer said: This is an organizational structure survey, the service process is very good, looking forward to the next cooperation. I wish users a prosperous career, evergreen foundation!
On July 13, 2021, Shangpu Consulting received a satisfaction evaluation sheet from the customer for the "Research Project on the Operation of a Brand. The customer said: The content of Phase I and Phase II is satisfactory, and we look forward to signing a long-term agreement in the later period. The research part of the country will continue to cooperate with your company. I wish users a prosperous career, evergreen foundation!
On July 13, 2021, Shangpu Consulting received a satisfaction evaluation sheet from the customer for the "Zhoushan Sand and Stone Aggregate Market Research Project. The customer said: I am very satisfied with the consulting service provided by Shangpu Consulting. Shangpu Consulting can think of the customer, solve the problem for the customer in time, and do not hesitate to work overtime to meet the customer's needs. Our company is very grateful for this. I wish users a prosperous career, evergreen foundation!
On July 15, 2021, Shangpu Consulting received a satisfaction evaluation sheet from the customer for the "Brand Building and Protection Solutions Enterprise Research Project. The customer said: overall very satisfied, timely feedback, smooth communication, hope to cooperate more. I wish users a prosperous career, evergreen foundation!
On July 16, 2021, Shangpu Consulting received a satisfaction evaluation sheet from the customer for the "Research Project on the Rental Market of Mounter. The customer said: I am very satisfied with the consulting service provided by Shangpu Consulting. Shangpu Consulting can think of the customer, solve the problem for the customer in time, and do not hesitate to work overtime to meet the customer's needs. Our company is very grateful for this. I wish users a prosperous career, evergreen foundation!
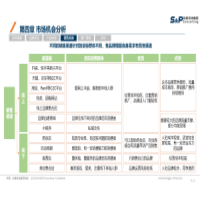
| Research Module | research content | ||||||
|---|---|---|---|---|---|---|---|
| Market research | Industry status | market capacity | Product Application | channel mode | Supply chain | market competition | Market Consulting |
| Enterprise Research | Enterprise background | Enterprise Finance | Sales Data | Market Strategy | Production Equipment | Supply Procurement | Technology R & D |
| warehousing logistics | channel construction | Human Resources | Enterprise Strategy | ||||
| User Research | Consumer Survey | consumption behavior attitude | Publicity/Promotion | Product Service | Brand Research | consumer characteristics | |
| satisfaction survey | Employee satisfaction | user satisfaction | |||||
| Market Entry Advisory | Macro Industry Research | competitive enterprise research | Downstream User Research | Channel Research | Due Diligence | Return on Investment | |
| Floor module | Landing implementation recommendations | Long-term cooperation | |||||
| Business investment due diligence | Target industry market investment value due diligence | Industry Benchmarking Enterprise Research | Target Enterprise Credit Assessment Report | Project investment due diligence | |||
| industry planning | Market research | market access | development strategy | investment location | Acquisition and integration | IPO Fundraising | |
| Credit Report | Basic information | Major Events | Production/Operation Network | enterprise scale | Operating strength | Financial strength | Legal risk |
| Future business prediction | Overall credit rating | cooperative risk warning | |||||
| Brand/Sales Proof | Market Share Proof | Market Share Proof | Proof of brand strength | Industry Proof | Specialized new proof | Proof of sales strength | Proof of technological leadership |
| National/Global Status Certificate | |||||||
15 Year
15 years of Shangpu consulting
48 Intellectual Property Rights
Independent methodology
80% of the information comes from first-hand research.
118 Billionth
Self-built database 11.8 billion
Covering 1978 industries in China
0.1 billion new data per year
Industry Big Data Platform
118 +
Have a 300 team of professional consultants
Practical operation and management experience of top enterprises
88% of members have international PMP certificates
48 Item
Independent methodology
48 independent intellectual property rights
high-tech enterprise
Industry Big Data Platform


400-969-2866
Scan to learn more information

Shangpu Consulting
Copyright Champu Consulting Group Co., Ltd. All Rights 京ICP备08011146号-6 Guo Tong Foreign-related Certificate No. 0709 Copyright @ 2008-2022 Shangpu-China.Com All Rights Reserved Map