


For detailed cases, please contact the consultant.
400-969-2866


2024-07-18 10:32:12 Source: Champ Consulting Visits:0
1. data analysis method
Data analysis is the core of market research, which refers to the process of data analysis, mining and insight through the use of a series of technologies and methods to extract valuable information and knowledge. Data analysis method is the main means of data analysis, which refers to the specific steps and rules used to process and analyze data. The choice and application of data analysis methods directly affect the effect and quality of data analysis, therefore, market research companies should choose appropriate data analysis methods according to different problems and purposes, use scientific statistical principles and techniques, and avoid misunderstanding and abuse of data.
Data analysis methods can be classified according to different dimensions. For example, according to the type of data, it can be divided into quantitative analysis and qualitative analysis; according to the source of the data, it can be divided into first-hand data analysis and second-hand data analysis; according to the purpose of the data, it can be divided into Descriptive analysis, exploratory analysis, inferential analysis and predictive analysis. When conducting data analysis, market research companies should consider various factors, choose the most suitable data analysis method, or combine a variety of data analysis methods to achieve the effect of data analysis. Below, we will briefly introduce several commonly used data analysis methods, as well as their characteristics and applicable scenarios.
1. Descriptive analysis
Descriptive analysis is a method of organizing and analyzing data through charts or mathematical methods, and estimating and describing the distribution of data, numerical characteristics, and relationships between random variables. The purpose of descriptive analysis is to summarize and summarize the data, provide basic information about the data, and lay the foundation for further data analysis. The methods of descriptive analysis include the following:
Centralized trend analysis: Centralized trend analysis mainly relies on statistical indicators such as averages, medians, and numbers to represent the centralized trend of data, I .e., the central location of the data. For example, if we want to know the average age, average income, average satisfaction, etc. of the respondents of a market research project, we can use the method of centralized trend analysis to calculate.
Off-center trend analysis: Off-center trend analysis mainly relies on statistical indicators such as full distance, quartile, mean difference, variance, standard deviation, etc. to study the off-center trend of the data, that is, the degree of dispersion of the data. For example, if we want to know the distribution and fluctuation of the age, income, satisfaction, etc. of the respondents of a market research project, we can use the method of off-trend analysis to calculate it.
Correlation analysis: Correlation analysis is a method used to explore whether there is a statistical correlation between data. This relationship includes both a single correlation between two data and multiple correlations between multiple data; both linear and nonlinear correlations; both positive and negative correlations; and the degree to which the two variables change together, I .e., the correlation coefficient. For example, if we want to know whether the age, income, education, consumption habits, etc. of the respondents of a market research project are related to their satisfaction with a product or service, we can use correlation analysis to calculate it.
Descriptive analysis is the basis of data analysis, which can help market research companies quickly understand the basic characteristics of the data, find the rules and anomalies of the data, and provide reference for subsequent data analysis. When conducting descriptive analysis, market research companies should pay attention to the following points:
Descriptive analysis can only describe the data, cannot infer and predict the data, nor can it determine the causal relationship between the data, and needs to be verified and interpreted in conjunction with other data analysis methods.
The results of descriptive analysis should be presented in appropriate charts or mathematical methods, avoiding the use of complex or misleading methods to make the data more intuitive, easier to understand and compare.
The results of descriptive analysis should be interpreted in the context of the actual business context to avoid over-interpretation or misinterpretation of the data, and to pay attention to the validity and representativeness of the data, as well as the limitations and biases of the data.
2. Informed analysis
Inferential analysis is a method of estimating and testing population parameters or distributions on the basis of known sample data to infer population characteristics or differences. The purpose of inferential analysis is to reason and judge the data, provide generalization and generalization of the data, and provide a basis for decision-making. The methods of inferential analysis include the following:
The main methods of parameter testing are as follows:
Single sampletInspection: single sampletA test is a method used to test whether the mean of a sample is equal to some known overall mean or hypothetical value. For example, if we want to know whether the average satisfaction of respondents to a market research project is the same as the industry average, we can use a single sample.tThe method of testing to test.
Double sampletInspection: double sampletA test is a method used to test whether the means of two independent samples are significantly different. For example, if we want to know whether there is a significant difference in the average satisfaction of two different target groups for a market research project, we can use a two-sampletThe method of testing to test.
Paired samplestInspection: Paired SamplestA test is a method used to test whether the means of two related samples are significantly different. For example, if we want to know whether there is a significant difference in the average satisfaction of respondents in a market research project before and after receiving a certain intervention or incentive, we can use a paired sample.tThe method of testing to test.
Analysis of variance: Analysis of variance is a method used to test whether the means of two or more independent samples are significantly different. For example, if we want to know whether there is a significant difference in the average satisfaction of three or more different target groups for a market research project, we can test it using ANOVA.
The chi-square test is a method used to test whether there is a correlation between two or more categorical variables. For example, if we want to know whether there is a correlation between the gender of the respondents of a market research project and their willingness to buy, we can use the chi-square test to test it.
The steps of parameter inspection mainly include the following:
Establish the original hypothesis and alternative hypothesis: the original hypothesis refers to the hypothesis to be tested, generally expressed.H0, usually an undifferentiated or unrelated hypothesis; an alternative hypothesis is one that is the opposite of the original hypothesis and is generally expressedH1, usually with discrepancies or related assumptions.
Determine the level of significance and test statistics: the level of significance refers to the probability of rejecting the original hypothesis, generally expressed as alpha, usually taken.0.05or0.0; Test statistics refer to the statistics used to test hypotheses. According to different test methods and data types, there are different calculation formulas and distributions.
Compute the test statistic andpValue: The test statistic is a value calculated from the sample data to measure the degree of deviation of the sample data from the original hypothesis;pThe value is the probability of obtaining a test statistic or a more extreme case under the condition that the original hypothesis holds, and is used to measure the strength of the evidence that rejects the original hypothesis.
making decisions and conclusions: according to the test statistics andpvalue, compare with the level of significance, make decisions and conclusions. Generally, ifpIf the value is less than or equal to the significance level, the original hypothesis is rejected, the alternative hypothesis is accepted, and the sample data is considered to be significantly different or related to the original hypothesis; ifpIf the value is greater than the significance level, the original hypothesis cannot be rejected, the alternative hypothesis cannot be accepted, and the sample data is not significantly different or related to the original hypothesis.
Inferential analysis is an important part of data analysis, which can help market research companies infer overall characteristics or differences from sample data and provide a basis for decision-making. Market research companies should pay attention to the following points when conducting infersive analysis:
The premise of infersive analysis is that the sample data is randomly selected and can represent the characteristics of the population, otherwise, the results of infersive analysis may be inaccurate or unreliable.
The results of an infersive analysis should be presented using appropriate graphical or mathematical methods, avoiding the use of complex or misleading methods to make the data more intuitive and easier to understand and compare.
The results of the inference analysis should be interpreted in the context of the actual business context to avoid over-interpretation or misinterpretation of the data, and to pay attention to the validity and representativeness of the data, as well as the limitations and biases of the data.
3. Predictive analysis
Predictive analytics is a method that uses historical and existing data to make predictions about future trends, behaviors, or outcomes by building mathematical models. The purpose of predictive analytics is to make predictions and plans for data, to provide forward-looking and guidance on data, and to provide reference for decision-making. The methods of predictive analysis include the following:
Regression analysis: Regression analysis is a method used to study the extent and direction of the impact of one or more independent variables (e. g., price, advertising, competition, etc.) on one or more dependent variables (e. g., sales, profits, market share, etc.). The purpose of regression analysis is to establish a functional relationship between the independent variable and the dependent variable, so that changes in the dependent variable can be predicted based on changes in the independent variable. The main methods of regression analysis are as follows:
Simple linear regression analysis: Simple linear regression analysis is a method used to study the linear effect of an independent variable on a dependent variable. For example, if we want to know the linear effect of the income of respondents to a market research project on their willingness to buy, we can use simple linear regression analysis to establish a linear functional relationship between income and willingness to buy.
Multiple linear regression analysis: Multiple linear regression analysis is a method used to study the linear effect of multiple independent variables on a dependent variable. For example, if we want to know the linear effect of the income, education, consumption habits, etc. of the respondents of a market research project on their willingness to buy, we can use multiple linear regression analysis to establish a linear functional relationship between income, education, consumption habits, etc. and willingness to buy.
Nonlinear regression analysis: Nonlinear regression analysis is a method used to study the nonlinear effects of one or more independent variables on one or more dependent variables. For example, if we want to know the nonlinear effect of the income of respondents to a market research project on their willingness to buy, we can use nonlinear regression analysis to establish a nonlinear functional relationship between income and willingness to buy.
Time series analysis: Time series analysis is a method used to study the patterns and trends of a series of chronological data. The purpose of time series analysis is to model time series so that future data changes can be predicted based on historical data. There are several main methods of time series analysis:
Smoothing: Smoothing is a method used to eliminate random fluctuations in time series and highlight the long-term trend of time series. The principle of smoothing is to replace the original data with the weighted average of the historical data of the time series, thus making the time series smoother and more stable. The main methods of smoothing are as follows:
Simple moving average method: The simple moving average method is a method of replacing the original data with the arithmetic mean of the most recent number of data in the time series. For example, if we want to know the smoothed value of the monthly purchase intention of the respondents of a market research project, we can use the simple moving average method to calculate it.
Weighted moving average method: The weighted moving average method is a method of replacing the original data with the weighted average of the most recent number of data in the time series. The principle of the weighted moving average method is to give a larger weight to the most recent data of the time series and a smaller weight to the earlier data of the time series, thus reflecting the latest changes in the time series. For example, if we want to know the smoothed value of the monthly purchase intention of the respondents of a market research project, we can use the weighted moving average method to calculate it.
Exponential smoothing: Exponential smoothing is a method of replacing the original data with the most recent data of the time series and the weighted average of the smoothed values of the previous period. The principle of exponential smoothing is to give a larger weight to the most recent data of the time series and a smaller weight to the smoothed value of the previous period of the time series, thus reflecting the latest changes in the time series. For example, if we want to know the smooth value of the monthly purchase intention of the respondents of a market research project, we can use the exponential smoothing method to calculate it.
Trend method: The trend method is used to analyze long-term trends in time series, I .e. the direction and extent of the main changes in time series. The principle of the trend method is to fit the trend of the time series with a curve or straight line, so that future data changes can be predicted according to the trend line. The main methods of the trend method are as follows:
Linear trend method: The linear trend method is a method of fitting the trend of a time series with a straight line. The principle of linear trend method is to assume that the change trend of time series is linear, that is, the rate of change of time series is constant. For example, if we want to know the trend of the annual purchase intention of the respondents of a market research project, we can use the linear trend method to fit a straight line.
Non-linear trend method: The non-linear trend method is a method of fitting the trend of a time series with a curve. The principle of nonlinear trend method is to assume that the change trend of time series is nonlinear, that is, the rate of change of time series is changing. For example, if we want to know the trend of the annual purchase intention of the respondents of a market research project, we can use the nonlinear trend method to fit a curve.
Seasonal method: The seasonal method is a method used to analyze seasonal changes in time series, I .e., the cyclical fluctuations of time series within a year. The principle of the seasonal method is to use a set of coefficients to represent the relative level of the time series in different seasons, so that future data changes can be predicted based on seasonal coefficients. The main methods of seasonal law are as follows:
Additive seasonality: The additive seasonality method assumes that the seasonal variation of the time series is trend-independent, I .e., the seasonal variation of the time series is constant. The principle of the additive seasonal method is to subtract the trend value from the actual value of the time series to obtain the seasonal change value, and then use the average of the seasonal change value as the seasonal coefficient, so that the future data changes can be predicted based on the trend value and the seasonal coefficient. For example, if we want to know the trends and seasonal changes in the quarterly buying intentions of respondents to a market research project, we can use the additive seasonality method to calculate it.
Multiplicative seasonality: Multiplicative seasonality assumes that seasonal changes in time series are trend-related, I .e., seasonal changes in time series are changing. The principle of the multiplication seasonal method is to divide the actual value of the time series by the trend value to obtain the seasonal change value, and then use the average of the seasonal change value as the seasonal coefficient, so that the future data changes can be predicted based on the trend value and the seasonal coefficient. For example, if we want to know the trends and seasonal changes in the quarterly buying intentions of respondents to a market research project, we can use the multiplicative seasonality method to calculate it.
Predictive analytics is an advanced aspect of data analytics that helps market research companies use historical and existing data to predict future trends, behaviors, or results for decision-making. Market research companies should pay attention to the following points when conducting predictive analysis:
The premise of predictive analysis is that the time series data is stable and there are no outliers or missing values. Otherwise, the results of predictive analysis may be inaccurate or unreliable.
The results of predictive analysis should be presented in appropriate charts or mathematical methods, avoiding complex or misleading ways to make the data more intuitive, easy to understand and compare.
The results of predictive analysis should be interpreted in the context of the actual business context to avoid over-interpretation or misinterpretation of the data, and to pay attention to the validity and representativeness of the data, as well as the limitations and biases of the data.
2. Data Visualization Technology
Data visualization is a technology that transforms data into visual elements through charts, graphs, animations, etc., so that data is more intuitive, easier to understand and remember. The purpose of data visualization is to display and communicate data, provide data aesthetics and attractiveness, and support decision-making. Data visualization techniques include the following:
Chart: A chart is a technique that displays information such as the quantity, proportion, change, and relationship of data in a graphical form. The purpose of the chart is to make the data more intuitive and easier to understand and compare. The types of charts are mainly the following:
Histogram: A histogram is a set of vertical or horizontal rectangles that represent the size or frequency of data. The purpose of a histogram is to compare differences or distributions of data. For example, if we want to know the comparison of the purchase intentions of different target groups for a market research project, we can use the bar chart method to show it.
Pie chart: A pie chart is a chart that uses a circle to divide data into different sectors in proportion to represent the composition or proportion of data. The purpose of a pie chart is to show the composition or percentage of data. For example, if we want to know the composition or proportion of the sex, age, income, etc. of the respondents of a market research project, we can use the pie chart method to show it.
Line chart: A line chart is a set of continuous lines that represent the trend of data over time or other factors. The purpose of a line chart is to show trends or fluctuations in data. For example, if we want to know the trend of the purchase intention of the respondents of a market research project over time, we can use the line chart method to show it.
Scatter plot: A scatter plot is a chart that represents the relationship between two or more variables with a set of scattered points. The purpose of a scatter plot is to show the correlation or distribution of the data. For example, if we want to know the relationship between the income and purchase intention of the respondents of a market research project, we can use the scatter plot method to show it.
Data visualization is an auxiliary link of data analysis, which can help market research companies transform data into visual elements, so as to make the data more intuitive, easier to understand and remember, and provide support for decision-making. Market research companies should pay attention to the following points when visualizing data:
The premise of data visualization is that the data is accurate and complete, without errors or missing values, otherwise, the results of data visualization may not be true or credible.
The results of data visualization should be presented in appropriate charts or graphs, avoiding inappropriate or misleading ways to make the data more intuitive, easier to understand and compare.
The results of data visualization should be interpreted in the context of the actual business context to avoid over-interpretation or misinterpretation of the data, and to pay attention to the validity and representativeness of the data, as well as the limitations and biases of the data.
3. Data Storytelling
Data storytelling is a technique that uses elements such as data, narrative, emotion, and logic to build compelling and impactful data stories that stimulate the interest and action of the audience. The purpose of data storytelling is to interpret and promote data, provide meaning and value of data, and power decision-making. Data storytelling techniques include the following:
Data: Data is the basis of data storytelling, which refers to data information obtained through data analysis and data visualization, such as data characteristics, differences, relationships, trends, etc. The role of data is to provide the content and evidence of data storytelling, and to support the logic and persuasion of data storytelling.
Narrative: Narrative is the core of data storytelling, which refers to the use of language or other means to organize data information into a meaningful story structure, such as the background of the story, problems, solutions, results, etc. The role of narrative is to provide the framework and process of data storytelling, guiding the attention and thinking of the audience.
Emotion: Emotion is the soul of data storytelling. It refers to the use of tone, intonation, expression, and action to connect data information with the audience's emotions, such as arousing the audience's curiosity, surprise, excitement, and sympathy. The role of emotion is to provide the atmosphere and appeal of data storytelling, and to attract the interest and emotion of the audience.
Logic: Logic is the guarantee of data storytelling, which refers to the use of reasoning, argumentation, comparison, etc., to link data information with the audience's cognition, such as explaining the cause, impact, and meaning of the data. The role of logic is to provide the rationality and credibility of the storytelling of the data, to convince the audience of their views and actions.
Data storytelling is an extension of data analytics that helps market research companies use elements such as data, narrative, emotion, and logic to build compelling and impactful data stories that inspire audience interest and action to power decision-making. Market research companies should pay attention to the following points when telling data stories:
The premise of data storytelling is that the data is true and valuable, and there is no false or irrelevant data. Otherwise, the results of data storytelling may not be credible or popular.
The results of data storytelling should be presented in appropriate language or other ways, avoiding complex or uninteresting ways to make the data story more vivid, interesting and powerful.
The results of data storytelling should be designed with the actual business context and the needs of the audience, avoiding over-interpretation or misinterpretation of the data, paying attention to the meaning and value of the data, as well as the impact and enlightenment of the data.
Conclusion
Market research companies are professional organizations that provide market research services that require the ability to collect, analyze and present data to meet the needs and expectations of their customers. From the three aspects of data analysis method, data visualization technology and data storytelling, this paper discusses how market research companies speak with data, that is, how to effectively use data, extract valuable information, and present it to customers in a clear and convincing way. This paper holds that market research companies should choose appropriate data analysis methods according to different problems and purposes, and use scientific statistical principles and techniques to avoid misunderstanding and abuse of data; at the same time, market research companies should master the basic principles and tools of data visualization, and use charts, graphs and animations to make data more intuitive, easier to understand and remember, market research companies should learn to use data to tell stories, using elements such as narrative, emotion and logic to build attractive and influential data stories that stimulate customer interest and action. This paper hopes to improve the ability of market research companies to speak with data, so as to enhance their competitiveness and value.
Consulting Services
economic database
See more>Brand Rankings
See more>
Shangpu Consulting Group: Market Survey of Top Ten Brands of imported Fruits in January 2023
Shangpu Consulting Group: Market Research on Top Ten New Products of Electrical Appliances in December 2022
Shangpu Consulting Group: Market Survey of Top Ten Popular Brands in January 2023

Shangpu Consulting Group: Market Research on Top Ten Brands of Home Administration Cleaning in January 2023
Shangpu Consulting-Market Research & Consulting China Pioneer
immediate consultationOn July 05, 2021, Shangpu Consulting received a satisfaction evaluation sheet from the customer for the "In-process Plastic Market Research Project in the Automotive Sector. The customer said: The project report completed by Shangpu Consulting in cooperation with our company is due to the wide range of projects and strong professional products. Thank you very much for the professional and detailed market research report of Shangpu Consulting. I look forward to cooperating again next time and wish Shangpu Consulting by going up one storey! Once again, I would like to thank the users for their support and wish them a prosperous career and an evergreen foundation!
On July 05, 2021, Shangpu Consulting received a satisfaction evaluation sheet from the customer for the "Research Project of the Network Designated City Transport Company. The customer said: The market research project provided by Shangpu Consulting for our company has provided us with a valuable reference basis for objectively evaluating the current market situation of the industry and achieved the expected goal. I also wish Champ Consulting the development of by going up one storey! Once again, I would like to thank the users for their support and wish them a prosperous career and an evergreen foundation!
July 07, 2020, Shangpu Consulting received a satisfaction evaluation sheet from the customer's "Lithium Battery Enterprise Sales Strategy and Production Cost Research Project. The customer said: The market research project provided by Shangpu Consulting for our company has provided us with a valuable reference basis for objectively evaluating the current market situation of the industry and achieved the expected goal. I also wish Champ Consulting the development of by going up one storey! Once again, I would like to thank the users for their support and wish them a prosperous career and an evergreen foundation!
On July 09, 2021, Shangpu Consulting received a satisfaction evaluation sheet from the customer for a hazardous waste treatment research project. The customer said: this is the organizational structure of the survey, the service process is very good, wish your company's consulting work is getting better and better, look forward to the next cooperation. I wish users a prosperous career, evergreen foundation!
On July 16, 2021, Shangpu Consulting received a satisfaction evaluation sheet from the customer for the Shared Beauty Research Project. The customer said: The content of Phase I and Phase II is satisfactory, and we look forward to signing a long-term agreement in the later period. The research part of the country will continue to cooperate with your company. I wish users a prosperous career, evergreen foundation!
On July 09, 2021, Shangpu Consulting received a satisfaction evaluation sheet from the customer for the "Research Project on the Organizational Structure of Two Liquor Production Enterprises. The customer said: This is an organizational structure survey, the service process is very good, looking forward to the next cooperation. I wish users a prosperous career, evergreen foundation!
On July 13, 2021, Shangpu Consulting received a satisfaction evaluation sheet from the customer for the "Research Project on the Operation of a Brand. The customer said: The content of Phase I and Phase II is satisfactory, and we look forward to signing a long-term agreement in the later period. The research part of the country will continue to cooperate with your company. I wish users a prosperous career, evergreen foundation!
On July 13, 2021, Shangpu Consulting received a satisfaction evaluation sheet from the customer for the "Zhoushan Sand and Stone Aggregate Market Research Project. The customer said: I am very satisfied with the consulting service provided by Shangpu Consulting. Shangpu Consulting can think of the customer, solve the problem for the customer in time, and do not hesitate to work overtime to meet the customer's needs. Our company is very grateful for this. I wish users a prosperous career, evergreen foundation!
On July 15, 2021, Shangpu Consulting received a satisfaction evaluation sheet from the customer for the "Brand Building and Protection Solutions Enterprise Research Project. The customer said: overall very satisfied, timely feedback, smooth communication, hope to cooperate more. I wish users a prosperous career, evergreen foundation!
On July 16, 2021, Shangpu Consulting received a satisfaction evaluation sheet from the customer for the "Research Project on the Rental Market of Mounter. The customer said: I am very satisfied with the consulting service provided by Shangpu Consulting. Shangpu Consulting can think of the customer, solve the problem for the customer in time, and do not hesitate to work overtime to meet the customer's needs. Our company is very grateful for this. I wish users a prosperous career, evergreen foundation!
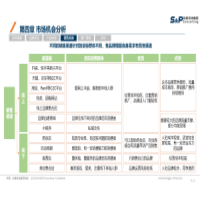
| Research Module | research content | ||||||
|---|---|---|---|---|---|---|---|
| Market research | Industry status | market capacity | Product Application | channel mode | Supply chain | market competition | Market Consulting |
| Enterprise Research | Enterprise background | Enterprise Finance | Sales Data | Market Strategy | Production Equipment | Supply Procurement | Technology R & D |
| warehousing logistics | channel construction | Human Resources | Enterprise Strategy | ||||
| User Research | Consumer Survey | consumption behavior attitude | Publicity/Promotion | Product Service | Brand Research | consumer characteristics | |
| satisfaction survey | Employee satisfaction | user satisfaction | |||||
| Market Entry Advisory | Macro Industry Research | competitive enterprise research | Downstream User Research | Channel Research | Due Diligence | Return on Investment | |
| Floor module | Landing implementation recommendations | Long-term cooperation | |||||
| Business investment due diligence | Target industry market investment value due diligence | Industry Benchmarking Enterprise Research | Target Enterprise Credit Assessment Report | Project investment due diligence | |||
| industry planning | Market research | market access | development strategy | investment location | Acquisition and integration | IPO Fundraising | |
| Credit Report | Basic information | Major Events | Production/Operation Network | enterprise scale | Operating strength | Financial strength | Legal risk |
| Future business prediction | Overall credit rating | cooperative risk warning | |||||
| Brand/Sales Proof | Market Share Proof | Market Share Proof | Proof of brand strength | Industry Proof | Specialized new proof | Proof of sales strength | Proof of technological leadership |
| National/Global Status Certificate | |||||||
15 Year
15 years of Shangpu consulting
48 Intellectual Property Rights
Independent methodology
80% of the information comes from first-hand research.
118 Billionth
Self-built database 11.8 billion
Covering 1978 industries in China
0.1 billion new data per year
Industry Big Data Platform
118 +
Have a 300 team of professional consultants
Practical operation and management experience of top enterprises
88% of members have international PMP certificates
48 Item
Independent methodology
48 independent intellectual property rights
high-tech enterprise
Industry Big Data Platform


400-969-2866
Scan to learn more information

Shangpu Consulting
Copyright Champu Consulting Group Co., Ltd. All Rights 京ICP备08011146号-6 Guo Tong Foreign-related Certificate No. 0709 Copyright @ 2008-2022 Shangpu-China.Com All Rights Reserved Map